Markets Now Believe the Fed
Genevieve Signoret & Delia Paredes
(Hay una versión en español de este artículo aquí.)
Remember how we told you that the Fed speaks to market participants all the time?
The Fed “talks” to markets through speeches, pressers, communiqués, statements of guidance, and releases of not only the macro and rate outlooks held by Fed officials but also visuals (at times, alarming!) depicting the risks they see and the magnitudes of their uncertainty.
To “listen” to Fed Speak yourself, check out this paragraph form its last meeting minutes (emphasis is ours):
In their discussion of inflation, participants observed that inflation had eased over the past year but remained above the Committee’s 2 percent inflation objective. They remained concerned that elevated inflation continued to harm households, especially those with limited means to absorb higher prices. While the inflation data had indicated significant disinflation in the second half of last year, participants observed that they would be carefully assessing incoming data in judging whether inflation was moving down sustainably toward 2 percent.
Fed communication efficacy requires that market participants listen and that their outlooks respond to those of the Fed. Markets do seem to have “heard” that paragraph: federal funds futures prices imply that market participants now assign a mere 2.3% probability of a rate cut in March, down from 81.5% at the beginning of the year.
But what about beyond March? Are markets taking to heart the Fed’s reluctance to cut?
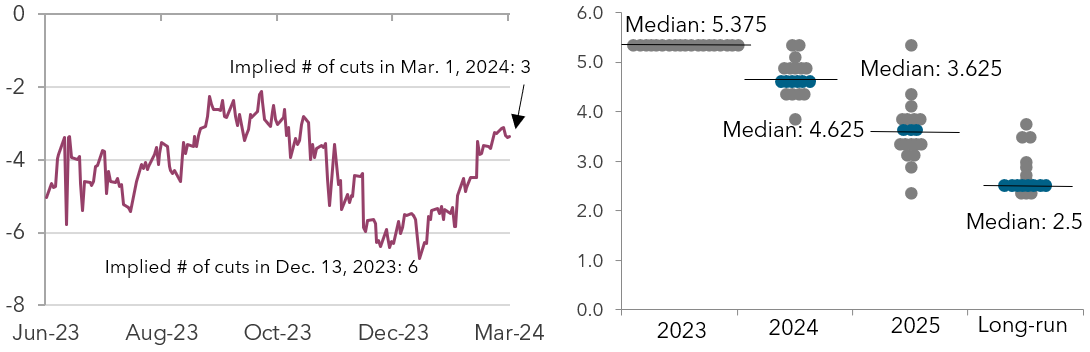
Yes, finally. Whereas last December 13, federal funds futures prices implied that market participants anticipated six rate cuts in 2024, today they imply only three, the same number that FOMC members forecast per their December 13 dot plot.
| Markets now agree with the FOMC forecast of its own behavior that the Fed will cut rates three times this year | ||
|---|---|---|
|
Number of cuts implied in Fed fund futures |
FOMC participants’ assessments of appropriate monetary policy (dot plot) |
|
 |
||
| Source: Bloomberg. | Source: Federal Reserve. [1] | |
1. Data based on projections as of December 2023. Blue dots indicate the median estimate. Each circle represents the value of an individual participant’s judgement of the midpoint of the appropriate target range for the federal funds rate at the end of the specified calendar year or over the long run.