Long-term rates and equity valuations
Genevieve Signoret & Delia Paredes
(Hay una versión en español de este artículo aquí.)
What follows is an excerpt from Quarterly Outlook 2023–2025: It All Hinges on Rates.
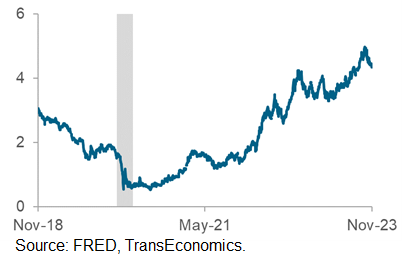
We believe that the greatest threats today to asset valuations are persistently high long-term U.S. rates and the risk that they will go higher still.
When we refer to rates in this report, we’re speaking of yields on long-term U.S. bonds. The benchmark long-term rate is the yield paid by the 10-year U.S. Treasury note. In spite of recent disinflation, this yield recently came close to hitting 5%—its highest level since 2007.
Long-term rates have persisted in climbing even as inflation has come down
USA: Market Yield on US Treasury securities at 10-year constant maturity, quoted on an investment basis, last 5 years
Percent
When we refer to assets in this report, we mean listed corporate stocks, privately held companies, commercial real estate, and homes. Reliable data on privately held company valuations is scarce, but we can examine data on the other three and discuss how rates can weigh them down. Let us do so now, one by one.
Long-term rates and equity valuations
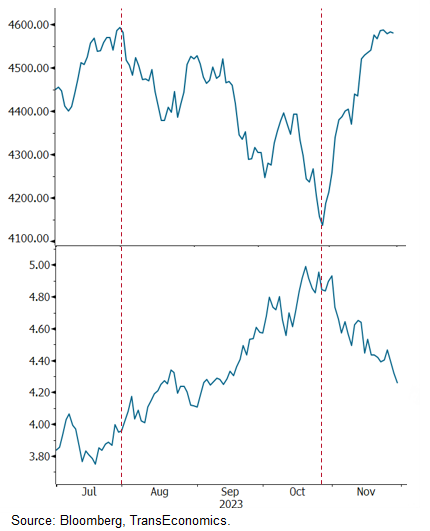
We start with equity. As we’ve harped on now for a couple of years, returns on stocks and bonds have displayed strong positive correlations since 2021, the opposite of what was true for the decade prior1. In recent months, that correlation has been especially clear.
Notice in the chart below how, since July 31 of this year, the S&P 500 Index and the yield on a 10-year Treasury note are practically mirror images of each other. As Genevieve recently explained here, we believe that the direction of causation has been from rates to equity valuations.
We believe that, since July, long-term bond yields have been driving equity valuations
S&P 500 Index (top) and yield on a 10-year U.S. Treasury note (bottom), since July 31
100=1928 for the S&P 500 Index and annual % rate yield for the 10-year note
Previous excerpts from Quarterly Outlook 2023–2025: It All Hinges on Rates:
1. Remember that bond prices move opposite to bond yields. From 2011 to 2020, the correlation coefficient between quarterly returns on the MSCI ACWI index and the iShares 20+ Year Treasury Bond ETF was –0.64, whereas, for January 2021 to October 2023, it was +0.68. (Source: Bloomberg.) Back.