Low PCE core inflation tells us Fed is wrong
Genevieve Signoret
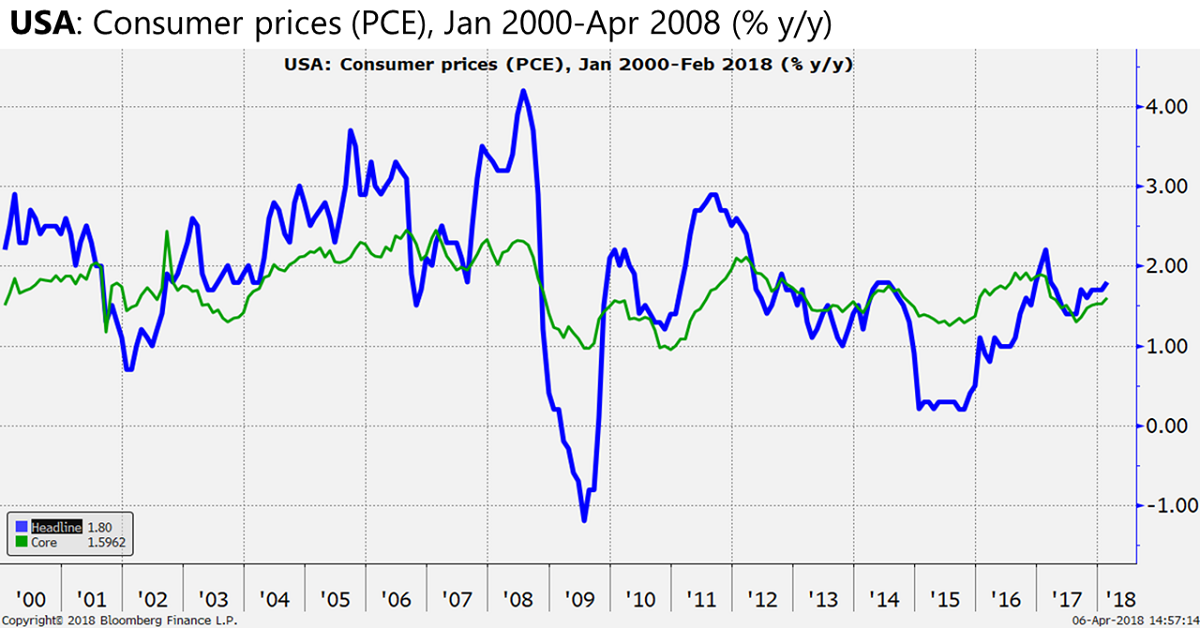
The Fed expects to speed up its pace of tightening although core PCE inflation persists below the Fed’s 2% target and despite Fed claims that 2% is a symmetric target, not a targeted upper limit.We think this is a mistake and that it will cause the Fed to continue to fail over the next two years to meet its target.
We think the Fed wrong to speed tightening with core PCE below target
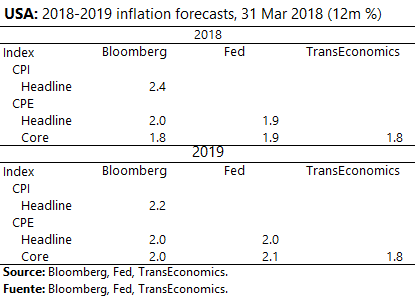
Because of this view, unlike the Fed itself and unlike the forecast consensus, we expect the Fed in 2018–2019 to keep on missing its target.
Hence, we (unlike Fed and consensus) think Fed will keep missing its target
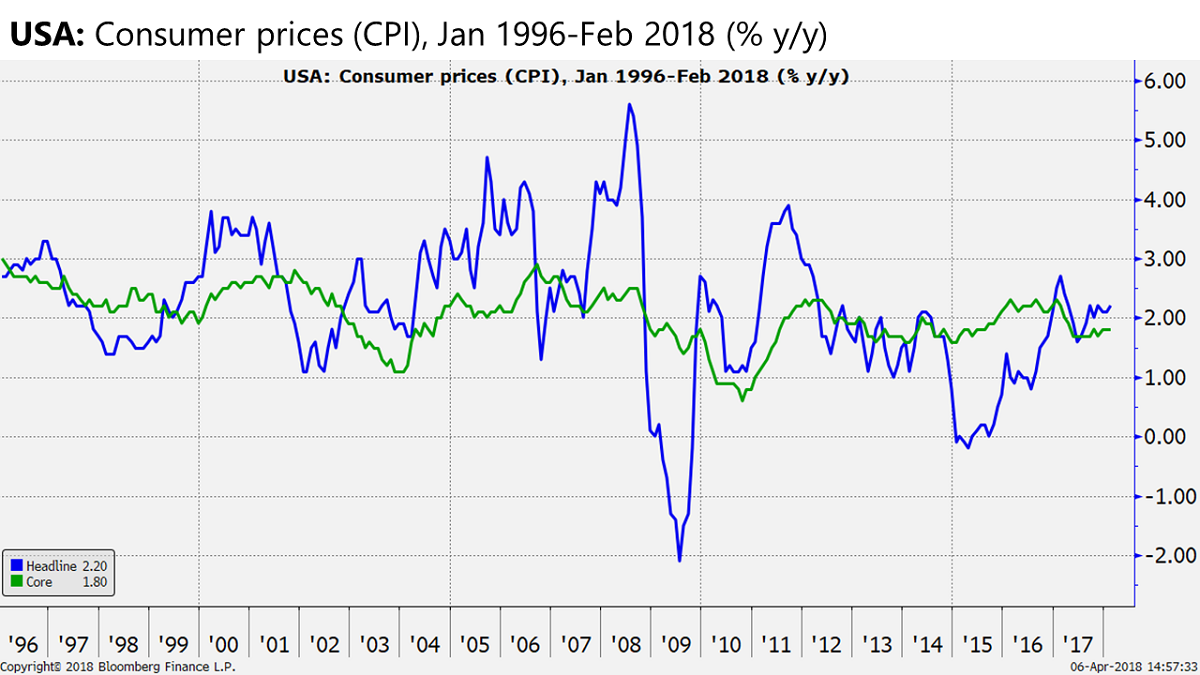
The letters “PCE” stand for Personal Consumption Expenditure, an index used to measure consumer spending on an extremely broad swath[1] of goods and services and their prices. Its core index excludes food and energy and thus marks underlying trends. A smaller basket of goods and services used to measure inflation is the Consumer Price Index, or CPI. Like the PCE, the CPI has index that excludes food and energy to help us detect emerging medium- and long-term trends; hence, their importance to the Fed and to inflation forecasters.
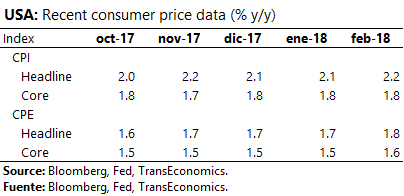
Although headline CPI inflation at 2.2% is now above the Fed’s favored 2%, core CPI inflation at 1.8% today is not.
Headline CPI inflation looks healthy but core still does not
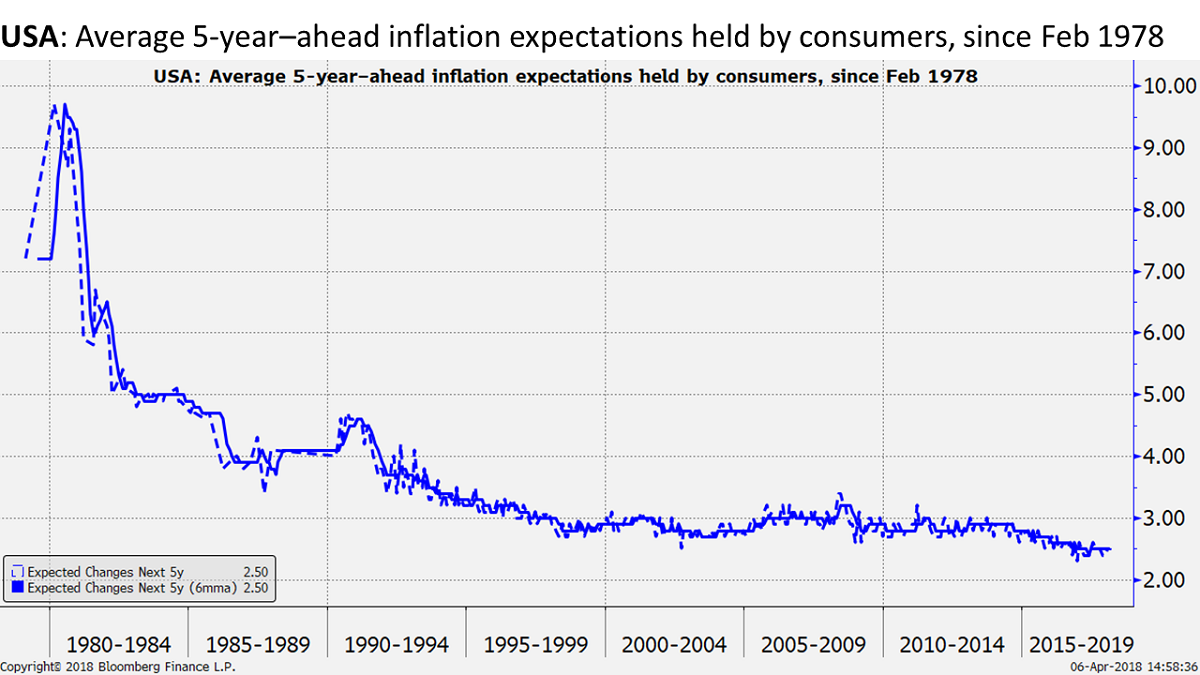
We now turn to inflation expectations, thought to drive inflation itself. They are measured in three ways: by consumer surveys, by surveys of professional forecasters, and through asset prices.
Fortunately, [2] although the Michigan Survey shows that the average inflation rate that consumers expect to emerge over the next five years has slid from about 3% to about 2.5%, it does seem to have stabilized. Should consumer-held inflation expectations resume their decline, it could cause the Fed to slow down or halt tightening.
Consumer inflation expectations are down but again stable
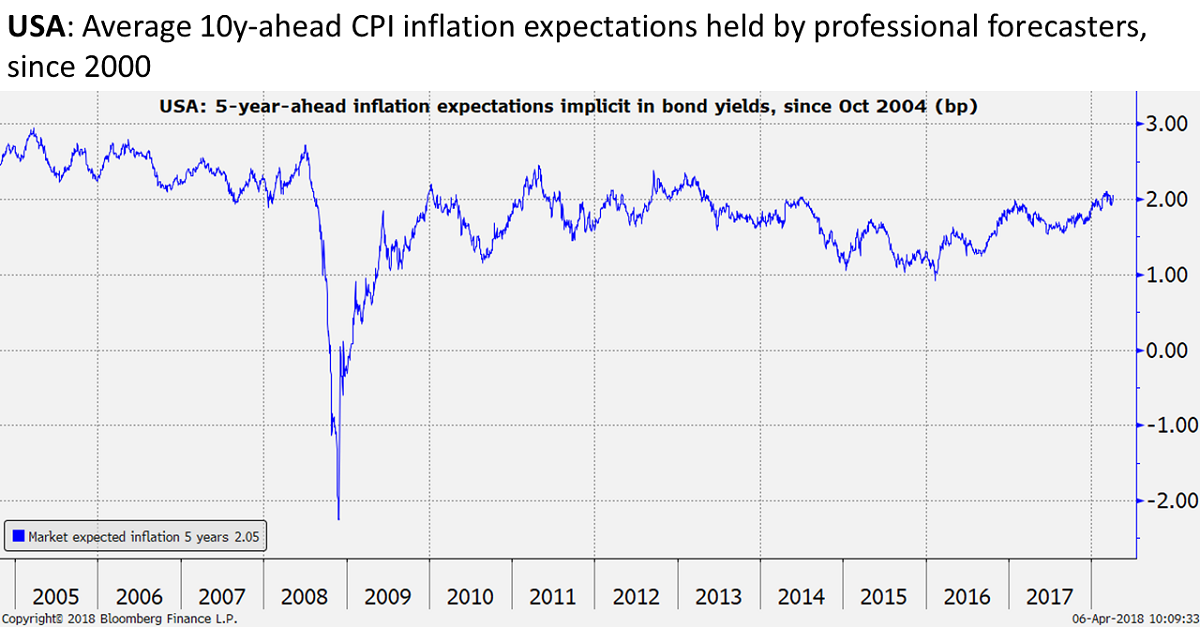
Professional forecasters’ inflation expectations have also fallen some but are now on a recovery trend. (If they look unstable to you below, it’s because of the scale.)
Professional forecaster inflation expectations have recovered

In addition to surveys of consumers and of professional forecasters, asset prices give off signals as to investor outlooks for inflation. The indicator we use is the premium that non–inflation-adjusted 5-year Treasury bonds pay over inflation-protected bonds of like maturities. We interpret[3] this spread to be telling us how much compensation market players must earn to induce them to take on the inflation risk of buying and holding to maturity nominal (rather than inflation-protected) bonds.
We infer from bond prices that the collective market outlook for U.S. inflation accumulated over the next five years is an annual rate of 2%. This is just where the Fed would like to see it. (Could this help explain why the FOMC is charging ahead with rate hikes despite persistently low core PCE inflation?)
Per bond market, Fed has met target. Hence faster tightening?
All these graphs we’re throwing at you are great for spotting trends but don’t tell you what inflation rates today are! Here are the key rates observed in the past five months:
Note how low core inflation rates remain
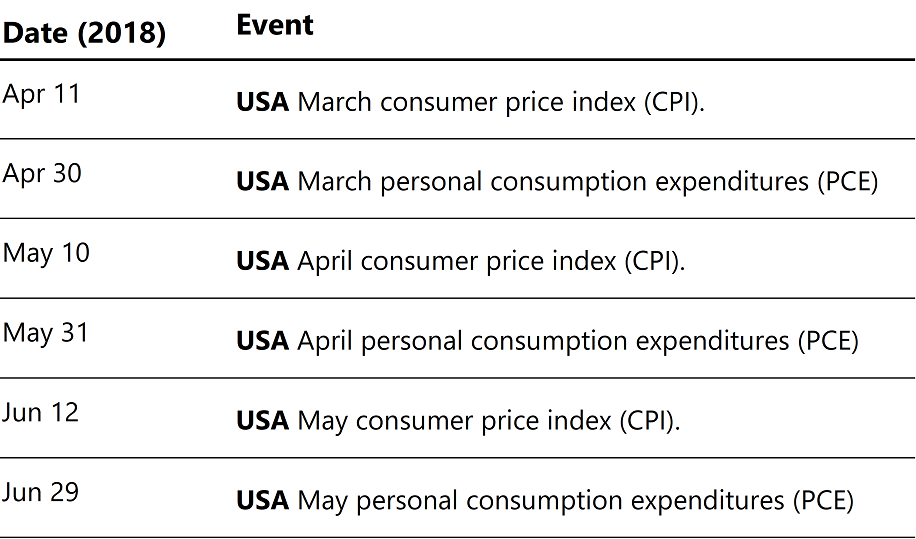
Looking ahead, the next data points, CPI headline and core inflation will be released on April 11.
More data is due on April 11
[1]The core PCE price index measures the prices paid by consumers for goods and services in a way that excludes the volatility caused by movements in food and energy prices to reveal underlying inflation trends.
[2]Our use of the word fortunately here may sound strange to the Mexican readers in our audience, whose experience of price instability has historically been taken the form of inflation. But, remember, the price instability risk facing the U.S. economy since 2008 has been that of deflation.
[3] This methodology has been surpassed in sophistication by other asset-price–based models developed in places such as the Cleveland Fed. But, as long-term investors looking on the lookout for shifts in trends found in glaring patterns, it works fine for us. Moreover, it’s easy to work with, understand, and explain to clients.