
The case for U.S. commercial real estate
Genevieve Signoret
Alternative Assets
First, some exciting news: We have a new international real estate partner, John Greenman! As a former banker involved in cross-border real estate deals around the world and later the head of acquisitions for an office REIT, John has decades of experience in analyzing and choosing sites and assets, structuring the financing, acquiring the assets, and managing them. He’s based in Denver, Colorado. John’s addition to our team means we can now offer clients illiquid U.S. commercial real estate asset holdings in addition to liquid real estate through ETFs. Rigorously selected and closely managed illiquid assets inside a well-diversified investment portfolio for a very high net worth investor with ample liquidity can yield outstanding returns and support long-term thinking and behavior.
We like commercial real estate versus housing chiefly because our clients generally already own housing, in some cases lots of it.
John is still shy about blogging himself, but I’ve coaxed him into conversing some with me by way of the comments section of this post. Thus he can complement my more macro views on US commercial real estate written from Mexico with his micro views written on the ground in the United States.
This blog post makes a case for U.S. commercial real estate from the point of view of growth and diversification. Of course real estate also produces income—we’ll develop that point another day. Today my main points are the following:
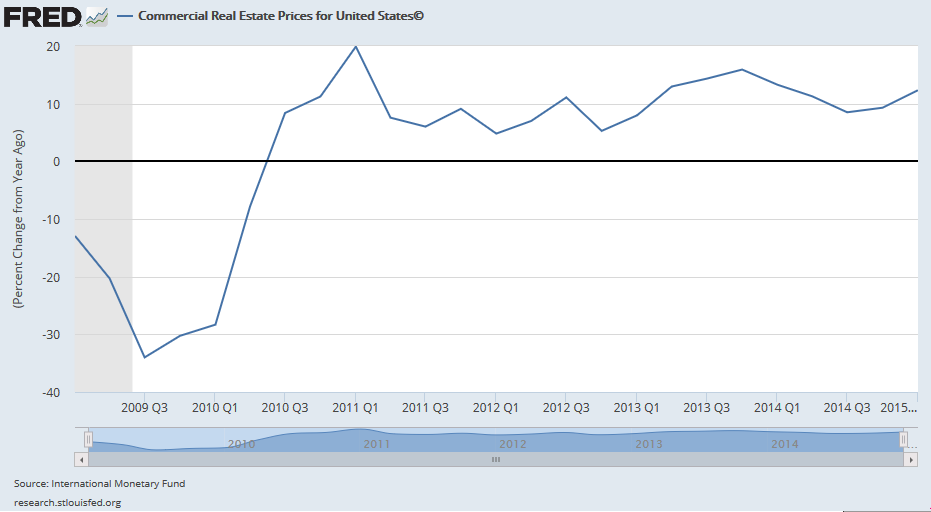
- U.S. commercial real estate has performed strongly in the past five years. We can see this directly by looking at national real estate price indices.
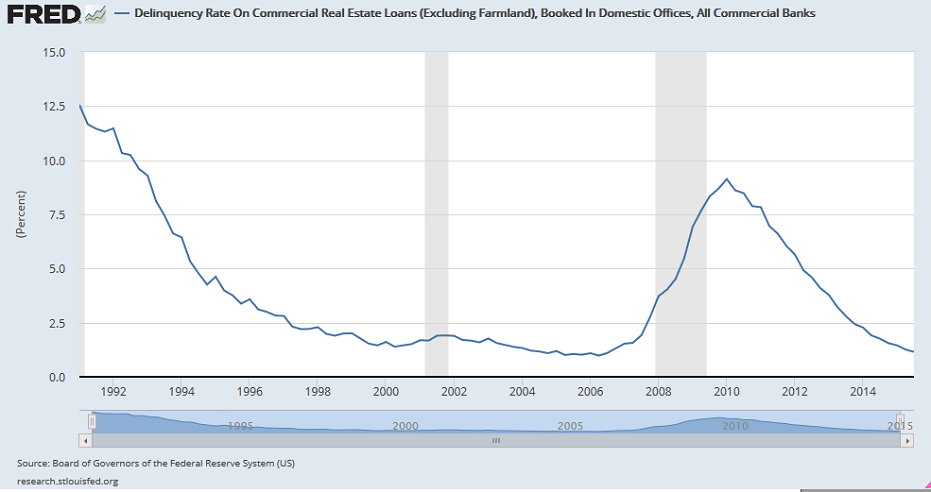
- We can also see it indirectly by looking at delinquencies on bank commercial real estate loans: they are back to pre-crisis levels.
- Finally, we can see it by comparing the performance of a large, liquid US real investment trust (REIT) ETF to various U.S. and global stock and bond indices.
- Commercial real estate offers low positive correlations to both stocks and bonds, meaning it performs well in diverse market conditions and its addition to any investment portfolio is likely to moderate that portfolio’s risk (volatility).
- Like other risk asset classes, this asset class has sold off in recent months, rendering today more attractive than a few months ago as an entry point.
Momentum is strong
U.S. commercial real estate has performed strongly in the past five years. We can see this directly by looking at a national commercial real estate price index constructed by the IMF and available on FRED.
US commercial real estate prices exhibit strong momentum
We can also see it indirectly by looking at delinquencies on bank commercial real estate loans, which have dropped back to pre-crisis levels:
Delinquencies on U.S. commercial real estate loans have dropped to pre-crisis levels
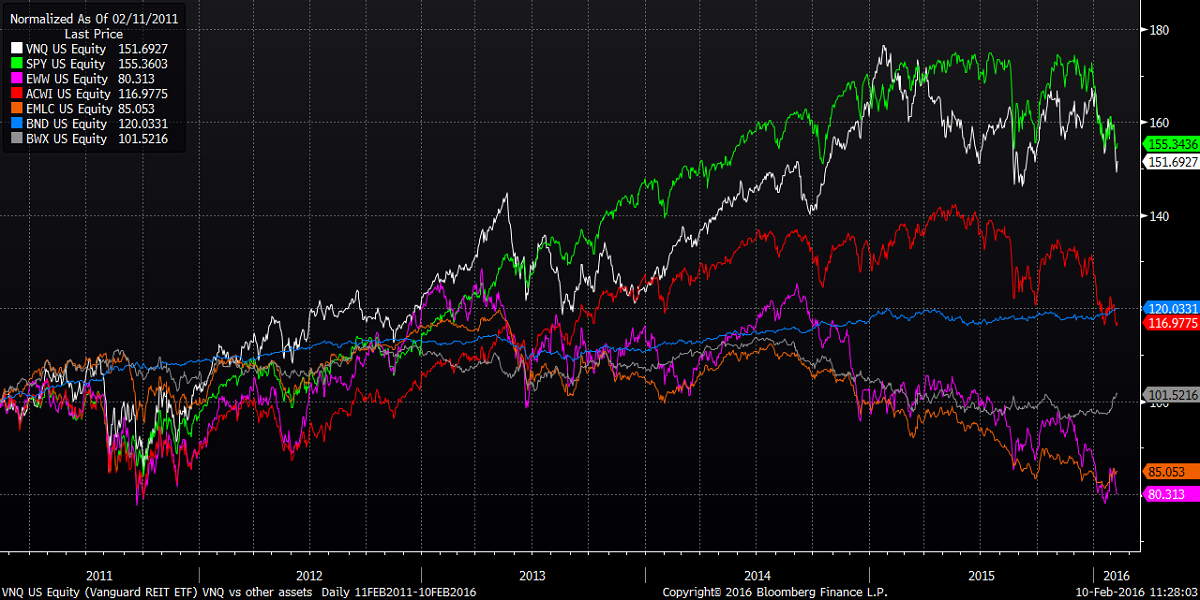
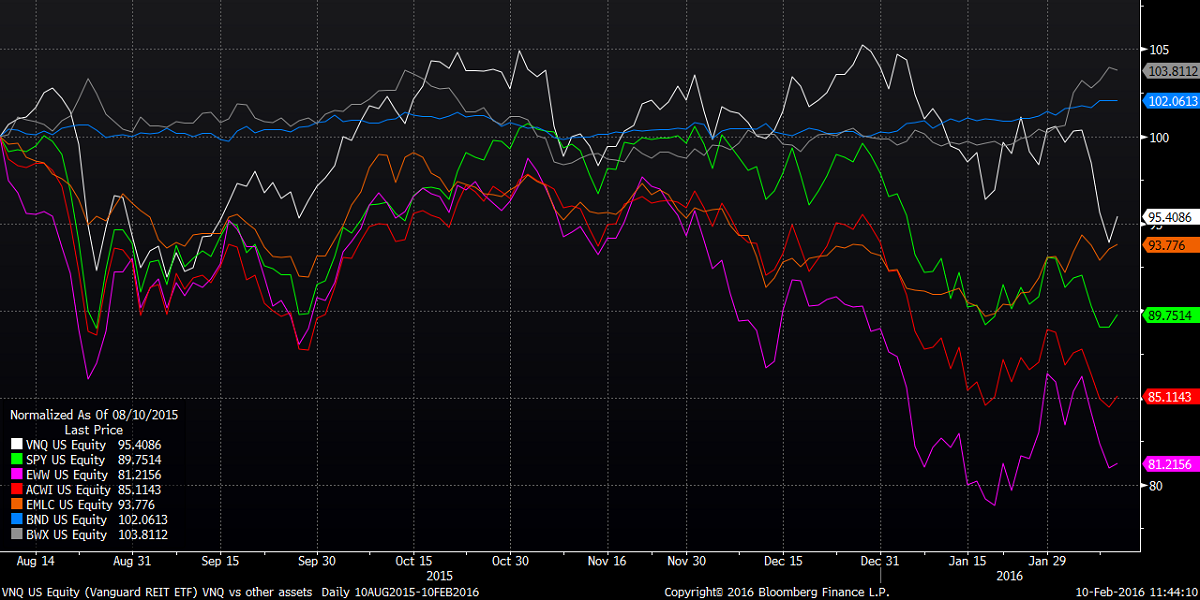
Finally, we can see it by comparing the performance of Vanguard’s large, liquid US real investment trust (REIT) ETF, VNQ, to ETFs that track various U.S. and global stock and bond segments. VNQ has an 83% allocation to commercial real estate, with the other 17% allocated to residential real estate. Below I show VNQ’s five-year performance compared with that of U.S. large-cap stocks (SPY), world stocks (ACWI), Mexican stocks (EWW), US bonds (BND), world sovereign bonds (BMX), and emerging market bonds (EMLC). VNQ matches in performance US large-cap stocks and outperforms all the other asset classes shown for comparison.
VNQ matches in performance US large-cap stocks and outperforms all the other asset classes shown for comparison
It can thrive in diverse market conditions
U.S. commercial real estate offers low positive correlations to both stocks and bonds, as seen in the positive correlation coefficients for VNQ compared with all the other ETFs graphed above in the following two-year correlation matrix.
U.S. real estate displays low positive correlations to both stocks and bonds
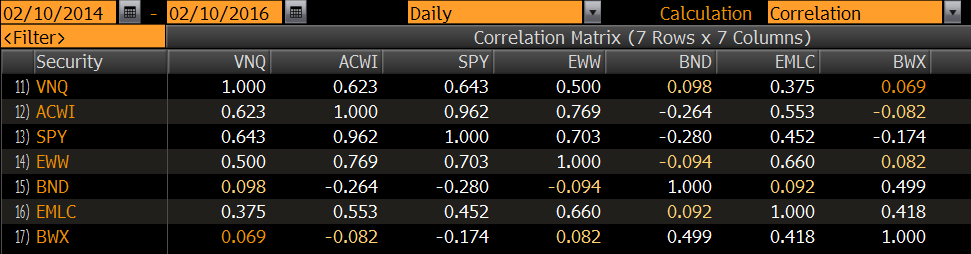
Correlation coefficients greater than one signals that valuations for this asset class can grow in diverse market conditions. In times of slow economic growth or recession, interest rates often drop or at least don’t go up. This supports real estate prices. In times of fast economic growth with inflationary pressures latent or observed, optimism drives up stock and real estate prices both. Also, at times like this, people worried about inflation look to hard assets such as real estate for protection.
It’s a good diversifier
The addition of US commercial real estate to any investment portfolio is likely to moderate that portfolio’s risk, or volatility. This we can see in the magnitude of the correlation coefficients. Notice how VNQ displays low correlations (coefficients lower than 0.65 in the matrix above) against all the other ETFs shown above, whereas the equity ETFs (ACWI, EWW, and SPY) exhibit high pairwise correlations (coefficients exceeding 0.75). When two asset classes exhibit low correlation, they don’t move up and down together every day proportionally but rather sometimes move opposite to each other. This moderates overall volatility. Hence, for example, a liquid or illiquid portfolio composed of only corporate stocks, even if globally diversified, will be more volatile than one containing both stocks and commercial real estate.
It offers better value today than a few months ago
Like other risk asset classes such as equity, U.S. commercial real estate has sold off in recent months, rendering today more attractive than a few months ago as an entry point.
We see this in the chart tracking VNQ’s price performance relative to progress in the same group of stock and bond ETFs as above. We focus this last chart on the past few months to zero the recent drop in price.
Compared with a few months ago, today is a better entry point to U.S. commercial real estate
This last point drives home a point I’ve made again and again: as long as we make sure to always have sufficient liquidity to seize on opportunities like today’s, volatility can be our friend.
As we can see from the first two charts, U.S. commercial real estate has recovered steadily since the cyclical bottom in 2008 and 2009. This recovery has been aided by steady demand for all the major property types (multi-family retail, office and industrial/distribution) and by the stability of low interest rates for debt. The multi-family sector in particular has benefited from very attractively priced debt financing via U.S. government agencies. The major markets of the East and West coasts have seen the most price appreciation, largely due to a tremendous inflow of Asian capital. Better value now can be found in high-growth cities of the Sunbelt. Commercial real estate pricing doesn’t move up and down as quickly as in the world of traded securities and although the last chart suggests some correction or plateauing, we will have to monitor markets in coming months to see whether that is really the case. In the end real estate investment is always a blend of assessing both the local “micromarket” conditions and the regional/national macro outlook.