
Which correlations?
Genevieve Signoret
Letter from the President
When talking about correlations across securities, we must be clear as to whether we’re referring to daily returns or prices.
An e-mail exchange that I had this week with a reader named Victor illustrates my point:
Victor: Why have TLT (iShares 20+ Year Treasury Bond ETF) and U.S. stocks been exhibiting positive correlation?
Me: They haven’t. Go to ETFscreen.com/corr.php and look up the six-month correlation coefficient for TLT versus SPY (SPDR S&P 500 ETF). You’ll find it says –0.36.
Victor: The correlation seems to change over time. On a chart I can see three periods since 2003 when TLT and S&P moved, not parallel, but in the same direction:

Me: Wait a minute. When you spoke of “exhibiting positive correlation,” were you referring to prices or to daily returns? Because, although in terms of daily returns, long-term Treasuries and stocks do generally exhibit negative correlations, as you point out, over different time periods, their prices can switch from trending together (exhibiting positive correlation) to trending opposite (negative correlation). I have an idea. Why don’t I explain this in more detail next Friday in my Letter from the President?
It’s next Friday now, so here we go.
As Victor pointed out, on trend, correlations between stocks and long-term investment grade bonds can switch signs. For example, often, when investors do not expect a recession but do anticipate that inflation and interest rates will remainlow for long, both stocks and long-term investment grade bonds will trend up.
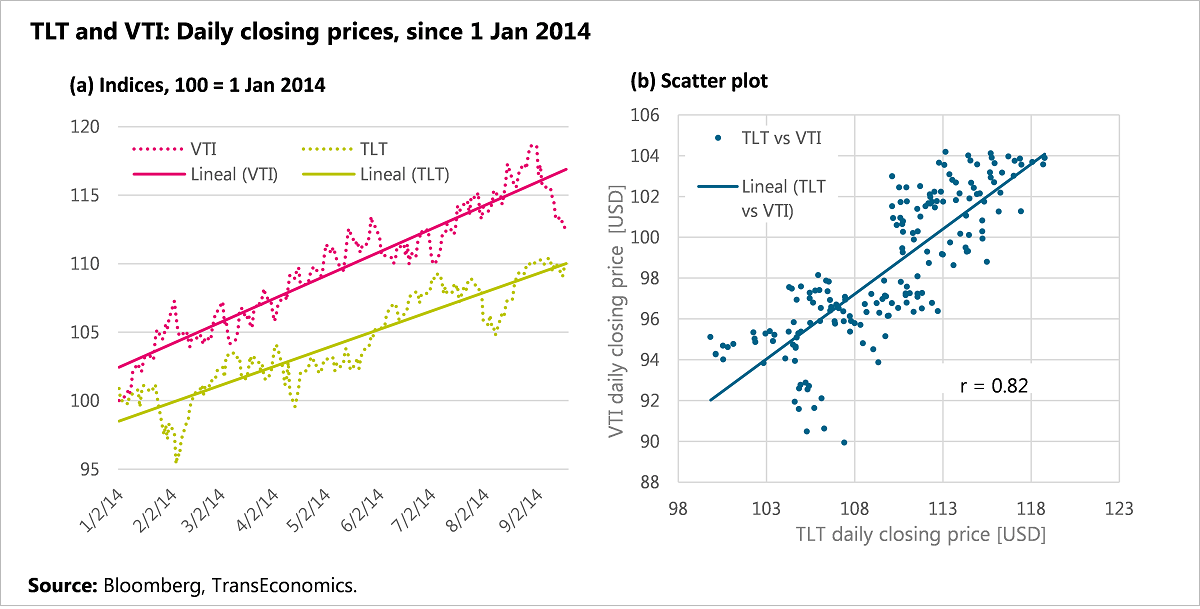
This has been the case so far in 2014. You can see this in the chart below depicting the behavior all year of TLT versus the Vanguard Total Stock Market ETF, VTI.
Notice how their prices, indexed to 1 January 2014, have both trended up this year (a). This is why their scatter plot has a positive slope (b). Also, notice that the relationship is fairly linear. A relationship both positive and fairly linear will have a large positive correlation coefficient—in this case, r = 0.82.
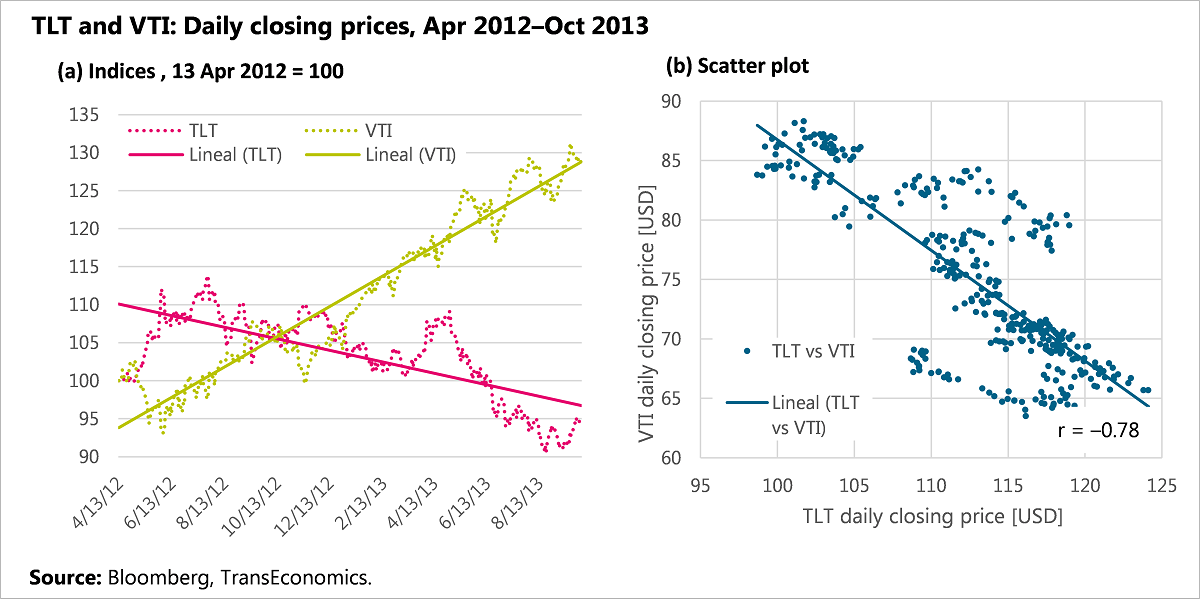
By contrast, in April 2012–October 2013 the two price trajectories diverged (a). So the scatter plot has a negative slope (b). Also, the relation is a bit less perfectly linear than in the case above. Put the two together, and you get r = –0.78.
Now let’s look at scatter plots of daily returns. The relationship between the two series of daily returns so far in 2014 is fairly linear and clearly negative (a): r = –0.51. If we examine the relationship between the other two series (b), those from April 2012–October 2013, we observe—quite surprisingly—a very similar pattern: r = –0.48.
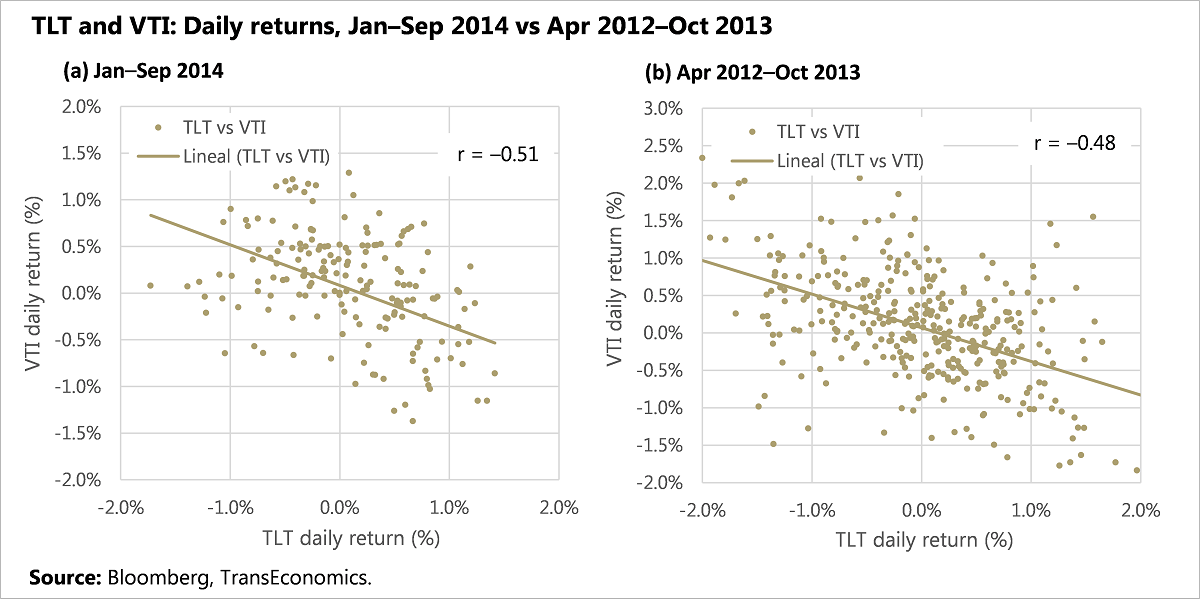
Conclusion: whereas the price trends of long-term U.S. Treasuries and U.S. stocks can be positively or negatively correlated depending on investor outlooks, their daily returns are almost always negatively correlated.
Three more things. Like Victor, I expected long-term Treasuries to trend down in 2014. So far, I’ve been wrong. Yet I hold to this view moving forward: I think a downward trend still looms.
Second, I think that the downturn, once it comes, will also hit stocks. In other words, I expect the positive price correlation between long-term Treasuries and stocks that we’ve observed all year to continue. In fact, this is what I have meant when I’ve written again and again in this blog that I expect that the market episode that awaits us once interest rate expectations shift will be one of volatility of the worst kind.
Third, I also think that, for stocks (but not bonds), said market correction will be transitory. And this is what I have meant when I have written here repeatedly that I expect the bull run to continue.
I’ll return in three weeks.
Previous Letters from the President
5 reasons not to participate in Alibaba’s IPO (2014 09 16)
2014–2016 Outlook: Low for long (2014 08 29)
Should you sell your business? (2014 08 15)
It’s the benign sort of volatility (2014 08 08)